Making the EDI Process more user-centric
EDI...really? Good luck designing a new workflow for that! That's what a heard from a colleague when I embarked on this journey. I later found out that no one else wanted to touch this project. But what is EDI anyway? Basically, EDI (Electronic Data Interchange) is the electronic interchange of business information using a standardized format; a process which allows one company to send information to another company electronically rather than with paper. EDI happens when you shop online. The data that you entered when you purchased that new phone case for your phone on Amazon needed to be converted to a different format in order for the merchant to fulfull your order. That data is converted using EDI.
Clear as mud, right? EDI also happens in the world of Insurance. Take PlanSource for example. PlanSource is an online software that allows employees of a company that uses it to "purchase" their benefits all in one place-yeah, pretty cool. The problem is, different types of insurance (medical, dental, vision, life, Health Savings Account, Flexible Spending Account) all have different requirements for how they must receive the data in order to properly enroll the employee in their plan. Enter EDI-the data sent to a Clearing House that converts the data to the correct format and then sent back to PlanSource. PlanSource then views the data that came back to ensure it is accurate and has no erros and finally sends the data directly to the Insurance Carrier.
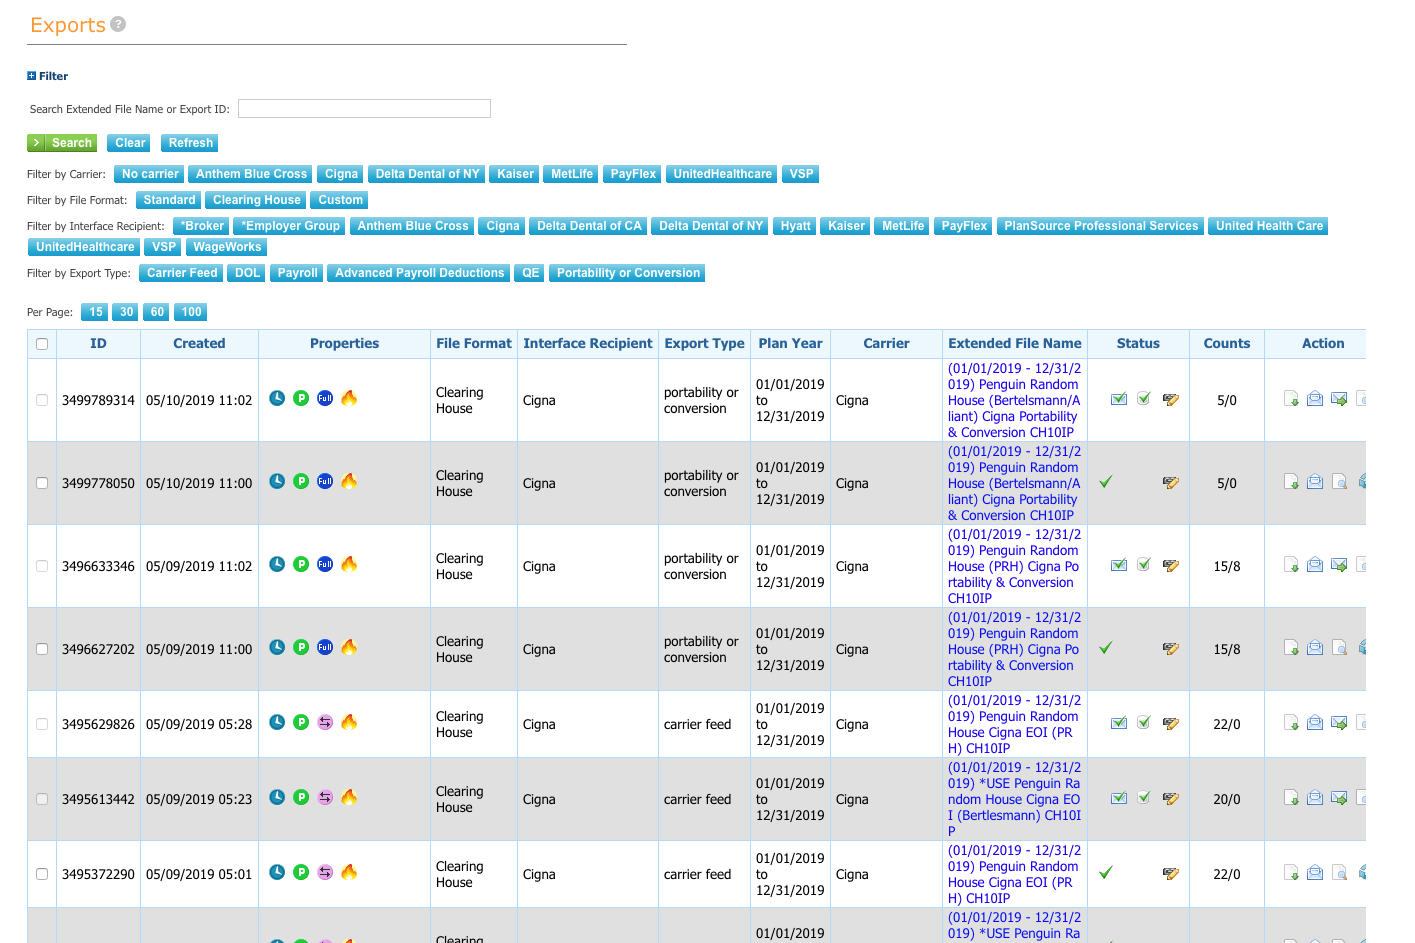
EDI Process
- We handle all makes and models
- Data is sent to the Clearing House for data conversion to the correct format
- A few minutes (usually) later, the Clearing House automatically sends the data back to PlanSource for review
- If the data is fine, it is then sent directly to Insurance Carrier
- If the data is incorrect or has errors, it is corrected and re-sent through the Clearing House. This process is repeated until the data is correct with no errors and then sent to the Insurance Carrier
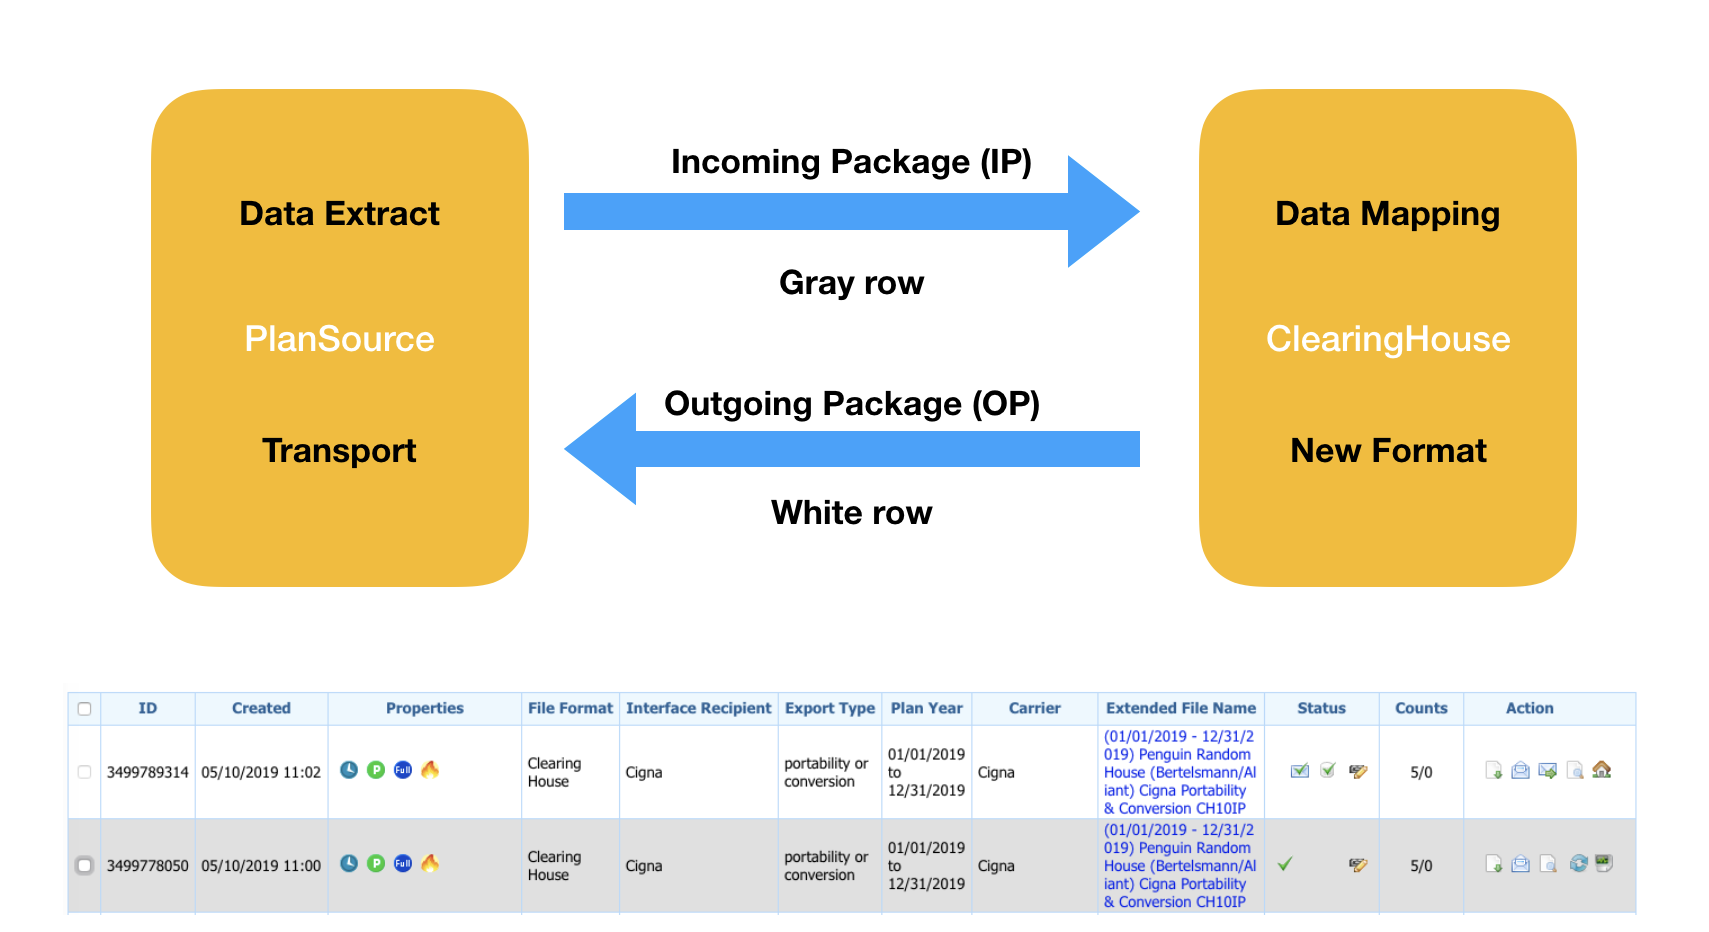
Distinguishing File Routing at a Glance
Tables are great for all kinds of tabular data because they can pack a lot of data in a relatively small space. However, in this case, a table falls short as you can see below. What you're looking at are files sent to the Clearing House (gray rows) and files that came back from the Clearing House (white rows).
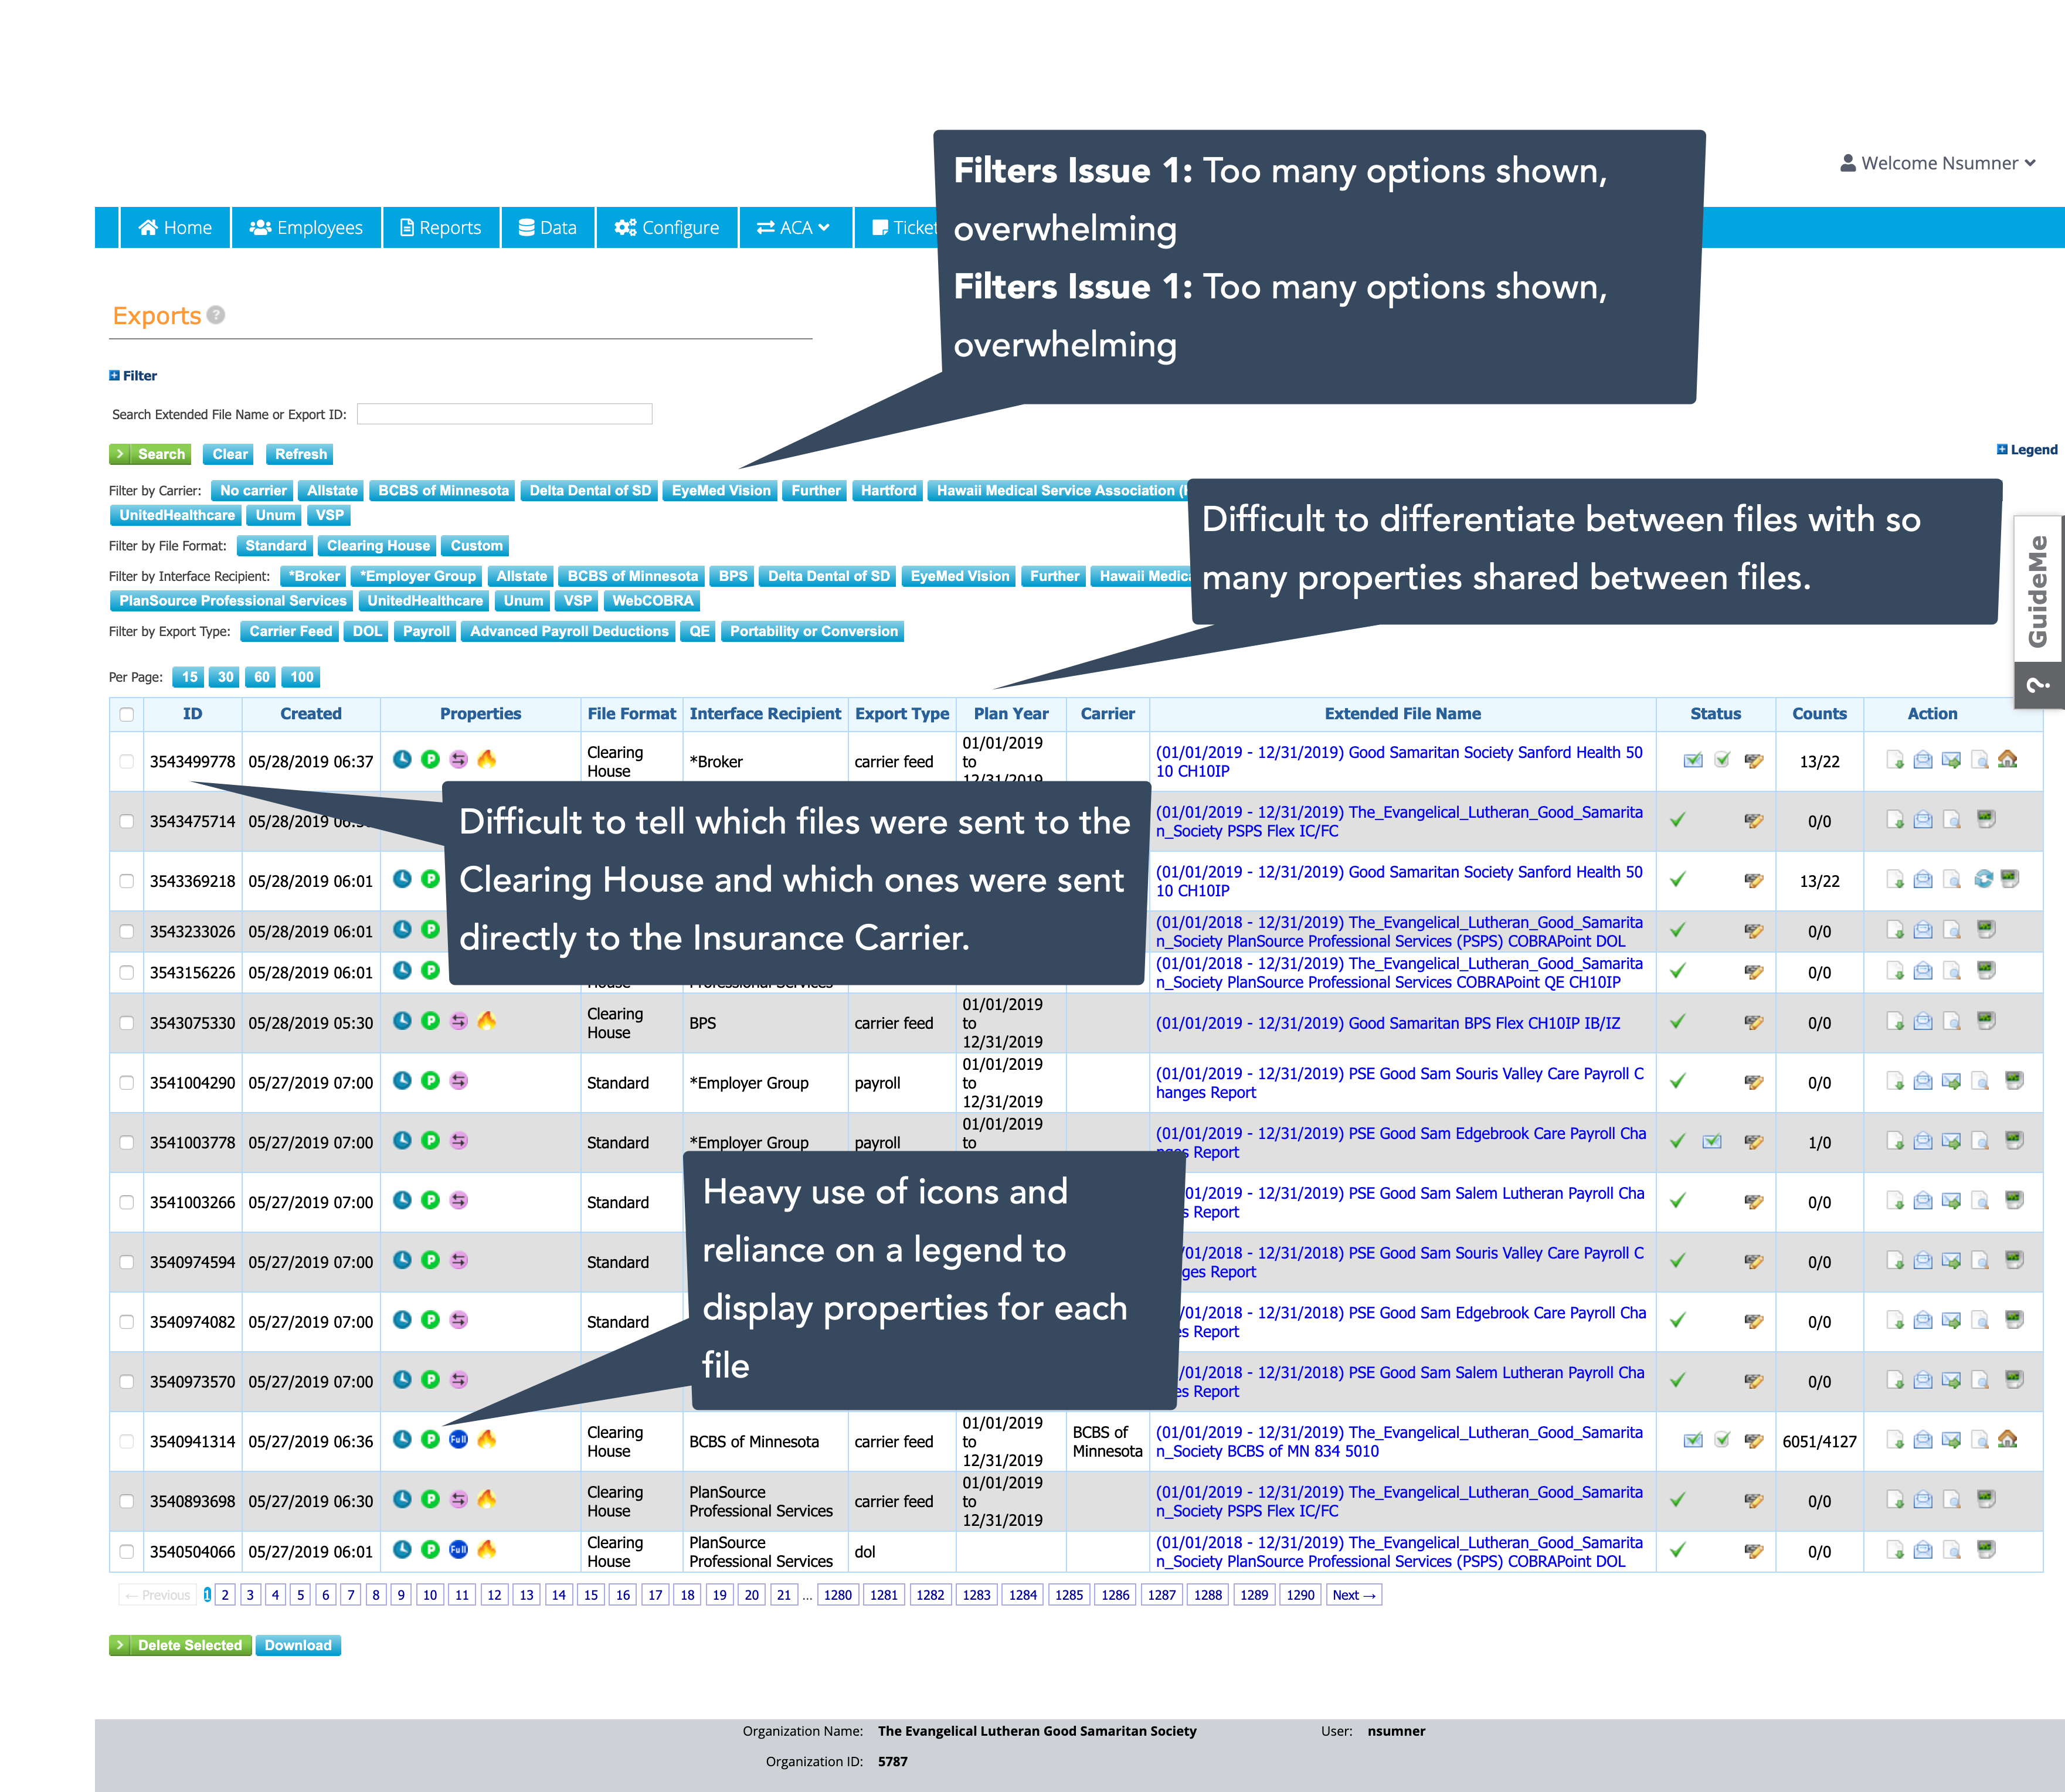
However, some files are sent directly to the insurance carrier, bypassing the Clearing House. In these cases, only one row is generated, making id difficult to see which files were sent to the Clearing House and which ones weren't. The only way to know is to look at the file name.
The Wireframe
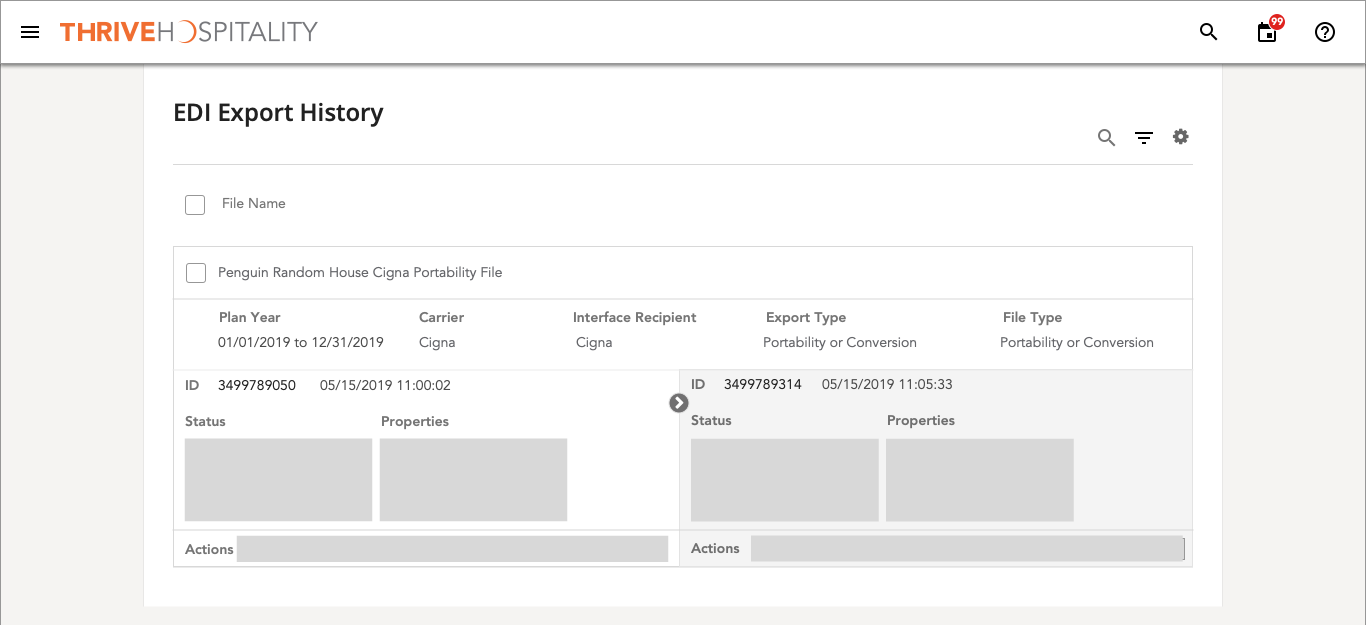
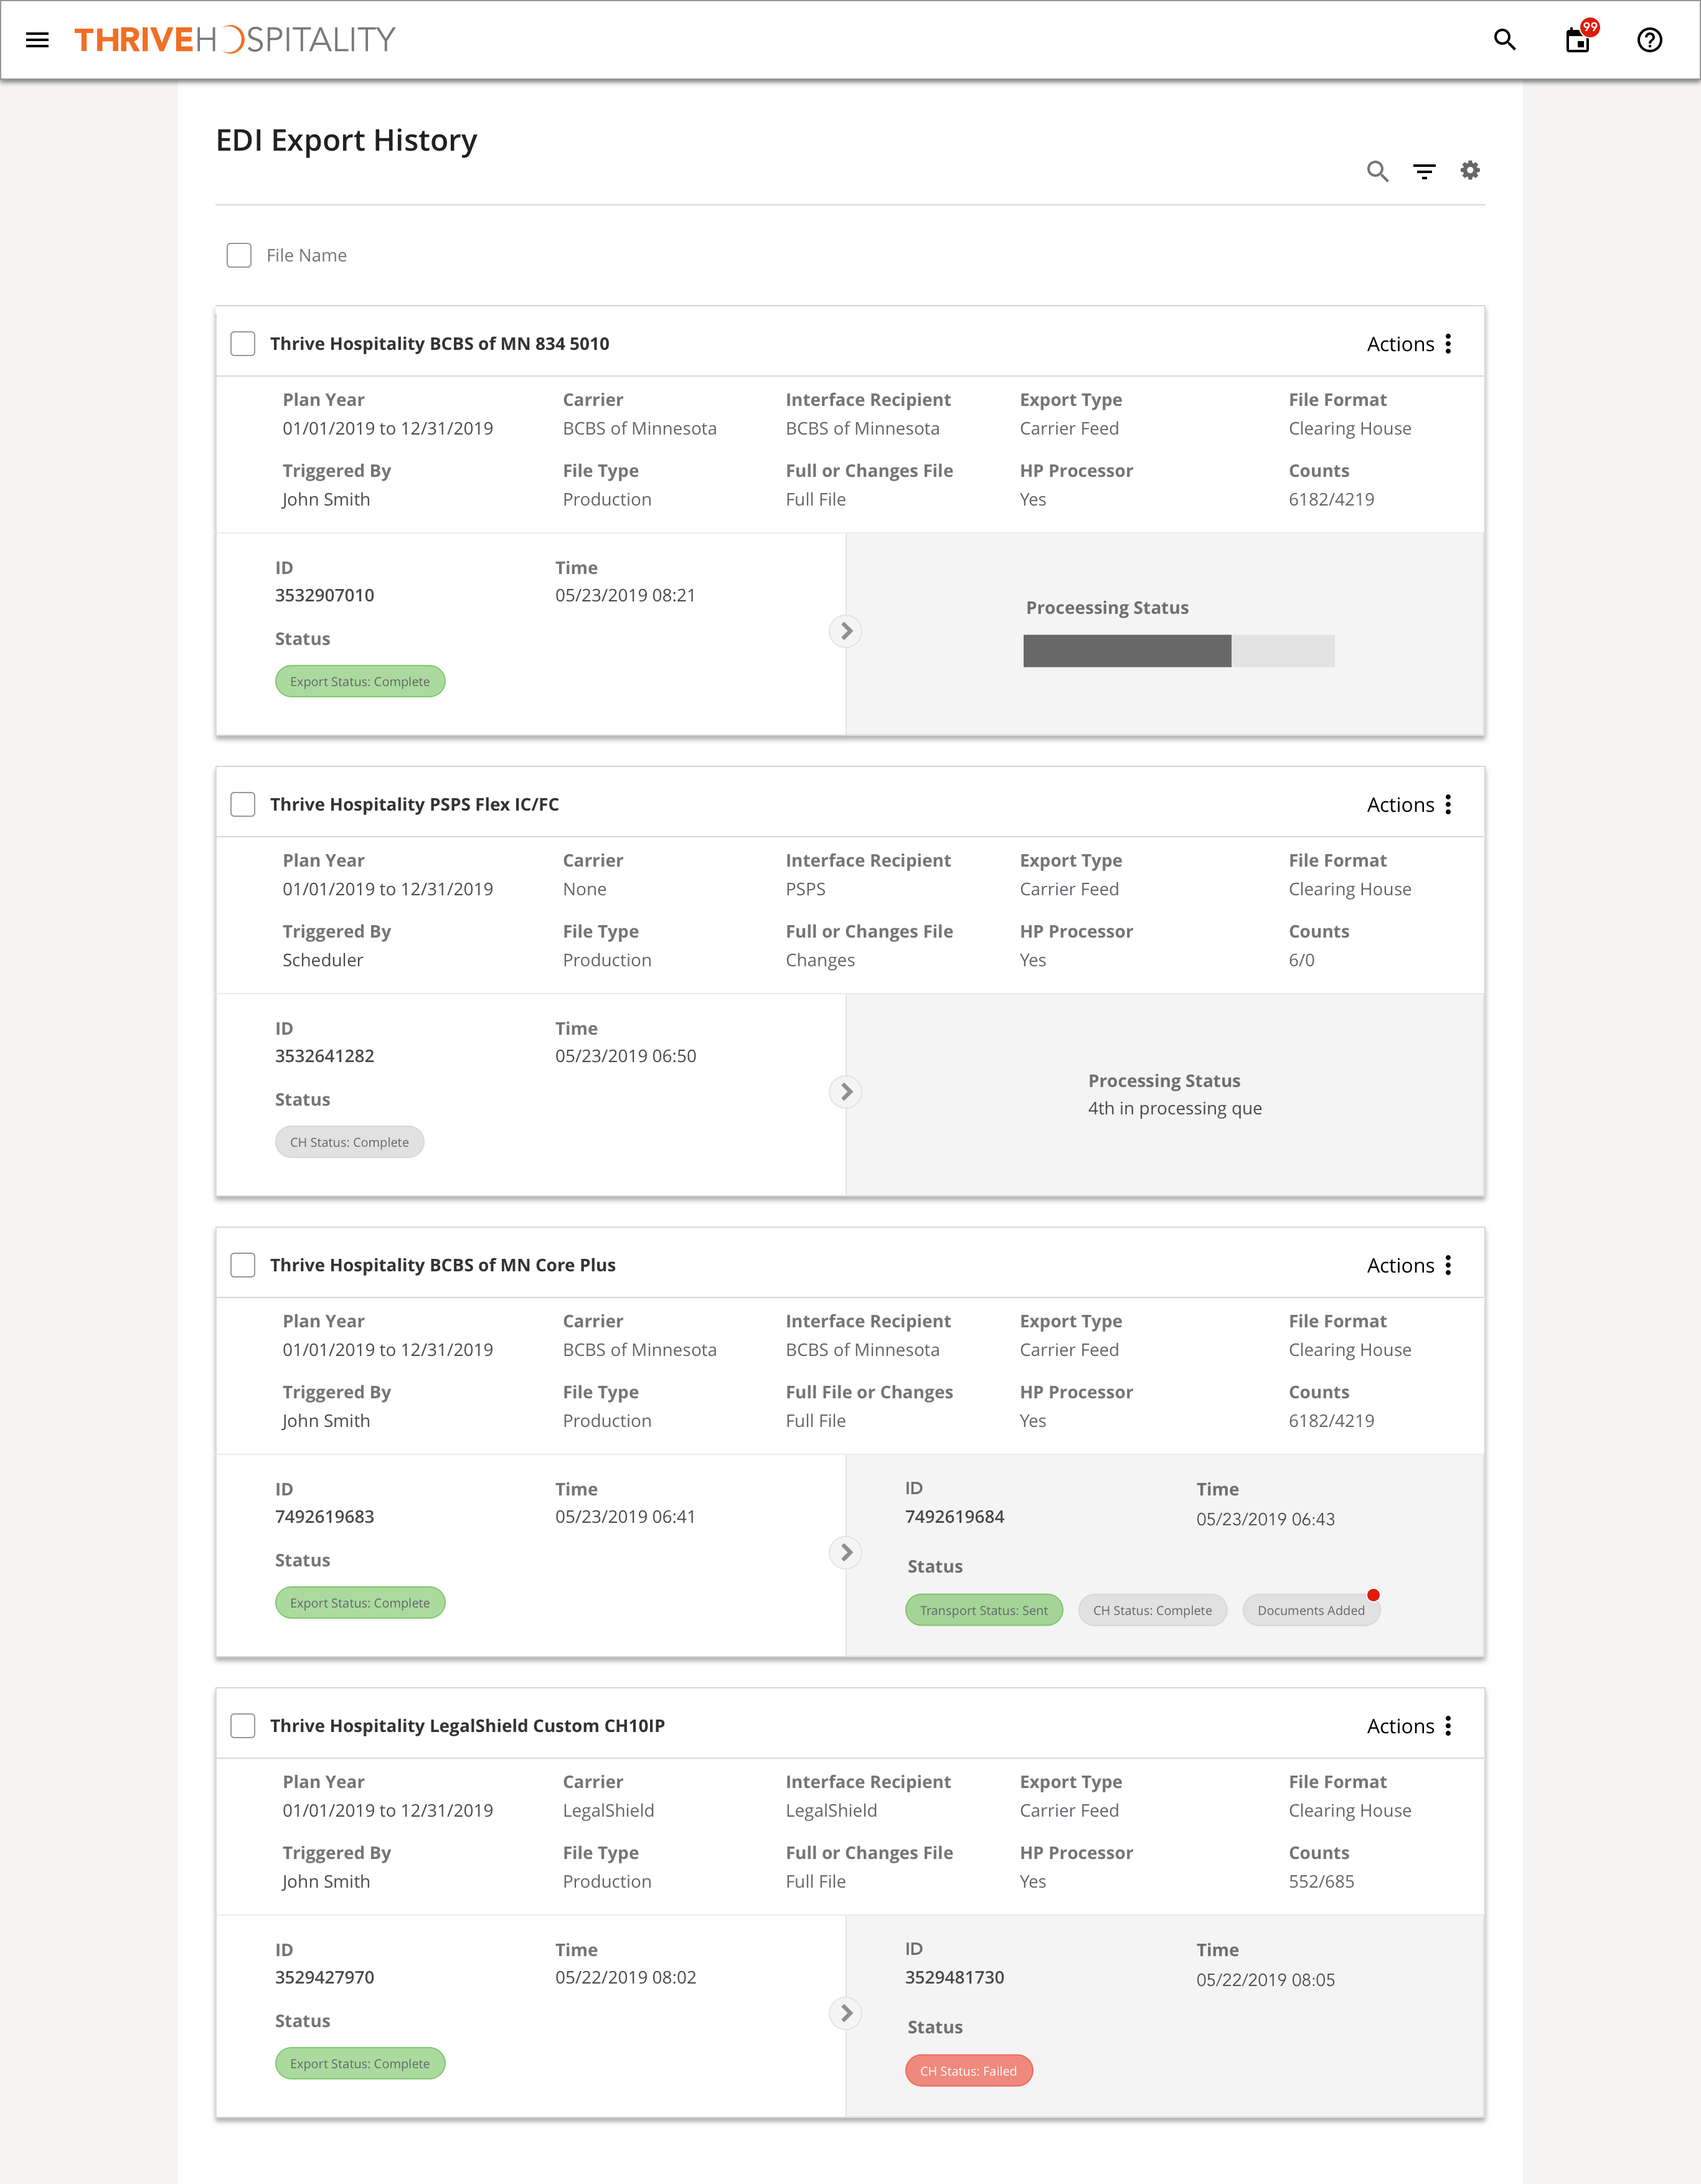
So this got me thinking. Most of the details of each file does not change, so why not separate that data from that actual data that can change and then compare the rest of the date side-by-side, since that is the whole point of this? Remember, the analyst is looking to see which data changed after passing through the Clearing House, which would indicate that something went wrong with the file and needs to be corrected.
The Prototype
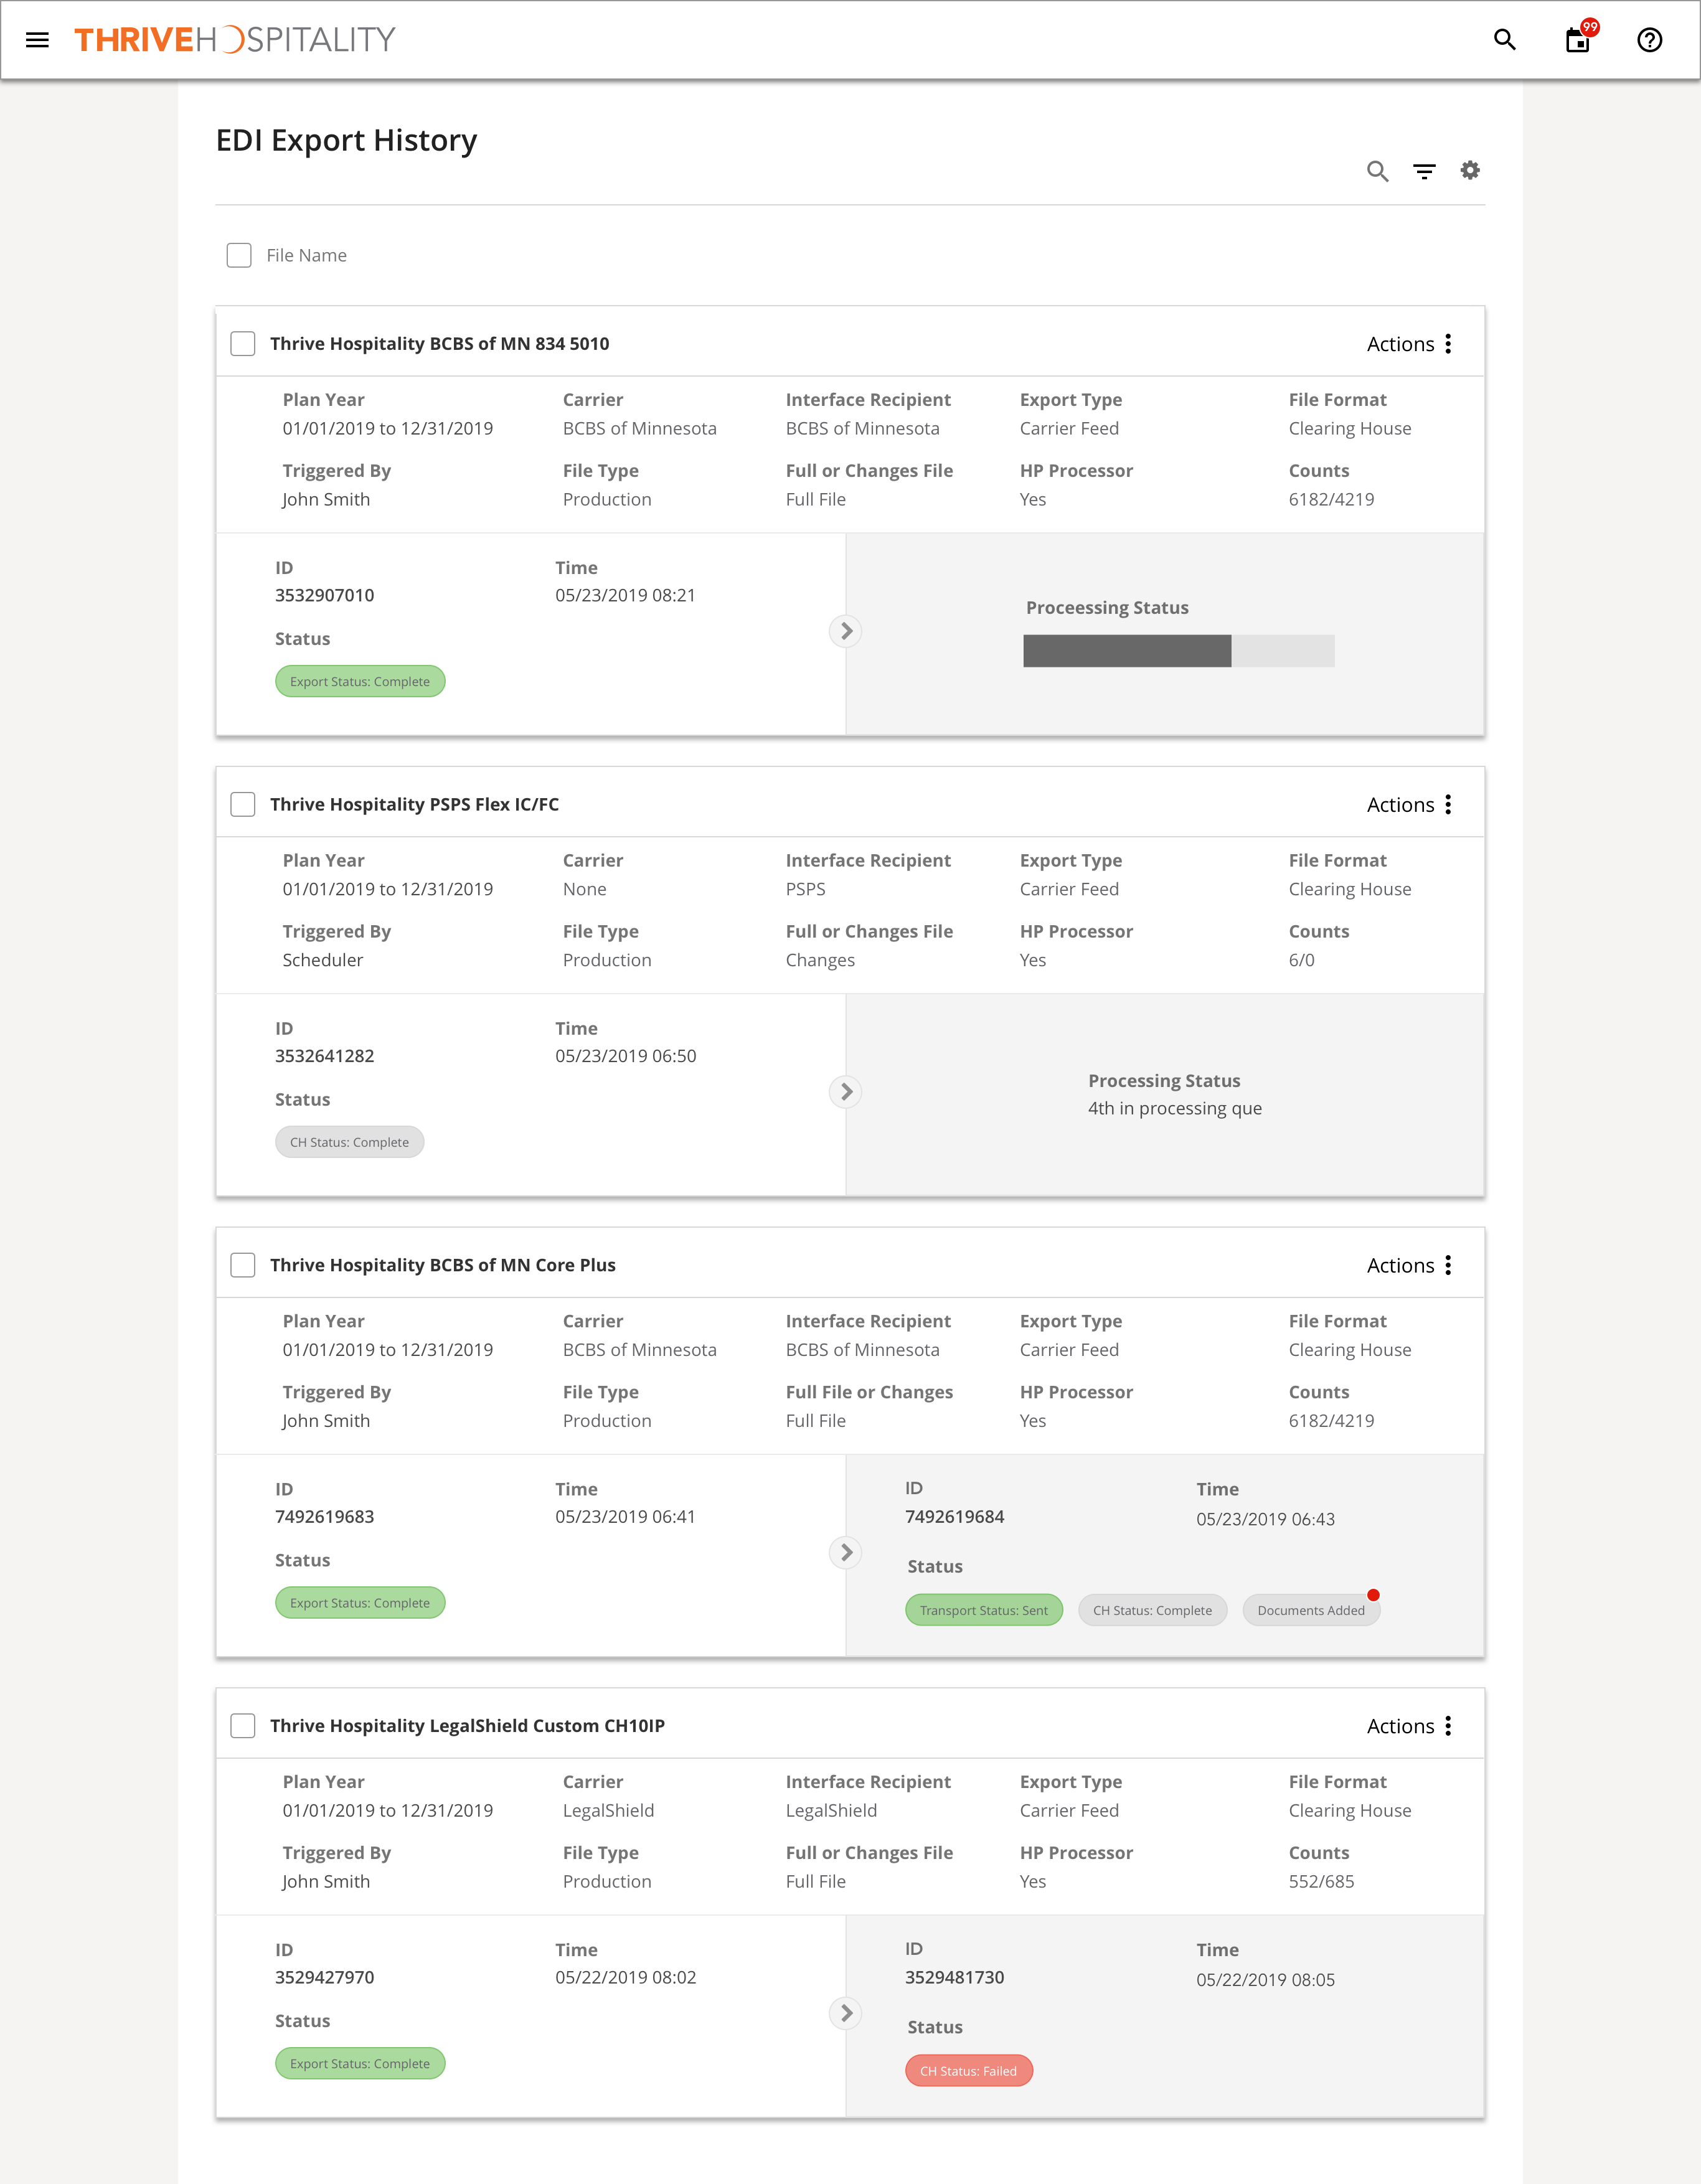
So here is the side-by-side comparison look. You can clearly see the differences in file sent to and from the Clearing House. An arrow indicator between the files shows the pre and post files. Since names (controlled by the user) tend to be long, I titled the card with the file name, giving it plenty of space. Additionally, the identical traits of each file were removed from the comparison and placed in their own section above it.
Validate Internally
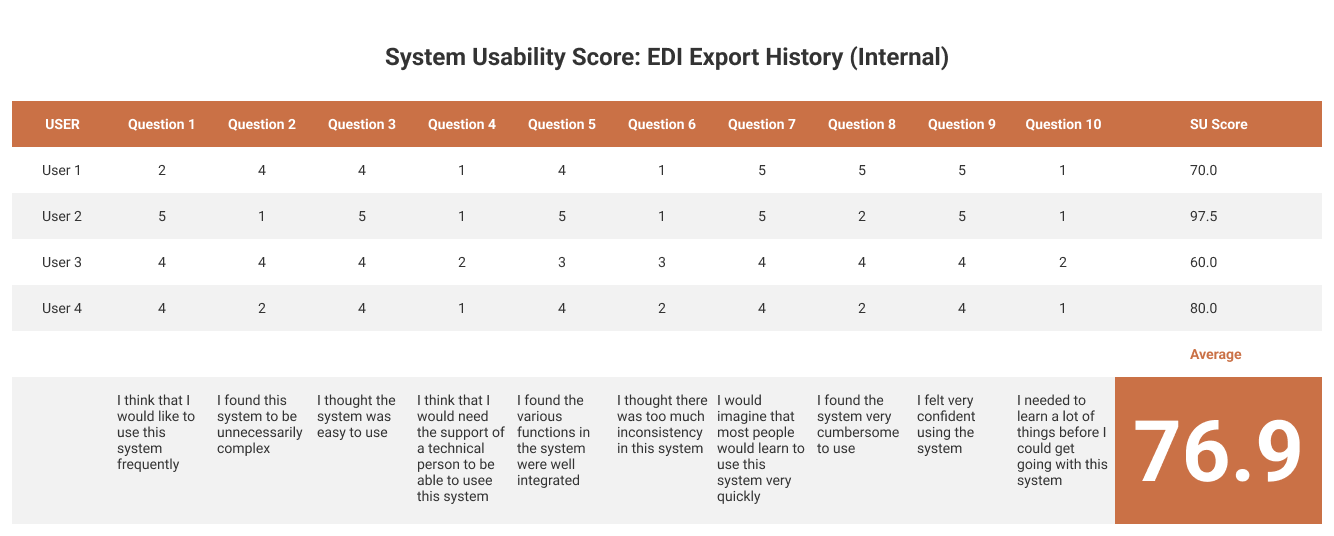
I tested 4 users from our EDI Team using the same test as the external one below. The UX standard for an acceptable SUS Score is 68 and this test resulted in a 76.9 - not bad. It is important to note here that you want to be careful reviewing internal test results. By nature, people don't like change, and the internal EDI staff was used to doing their job a certain way.
A common quote from the user testing videos was "I'm going to have to change how I do my job a bit". However, most of them later admitted that the new UX and design was far better than the current legacy.
Test Externally
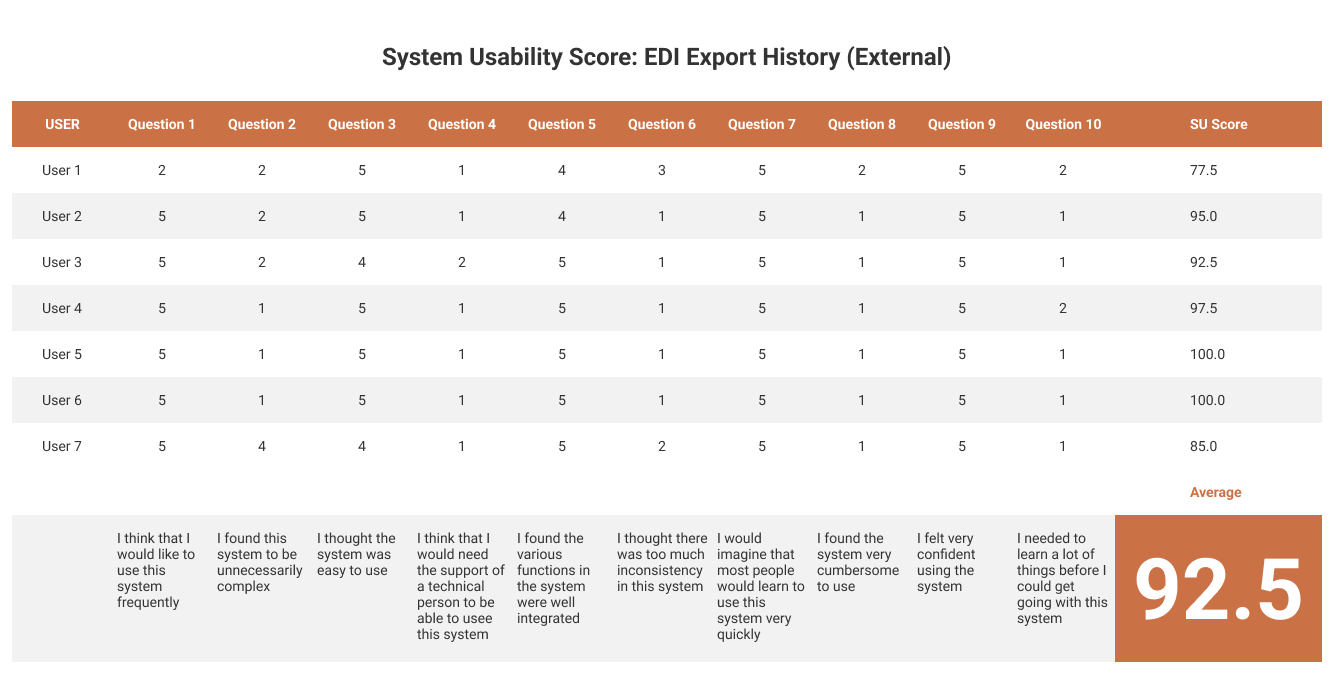
Seven (7) test subjects were used through UserTesting.com using a prototype of the workflow built on InVision. The UX standard for an acceptable SUS Score is 68 and this test resulted in a 93, thus validating the workflow on external users. I only tested users who work currently with EDI.
Overall User Testing Results
Task-Based Test
- Ease of differentiating between files being processed, waiting to be processed, and have been processed
- Edit a Transaction Status
- View Clearing House Logs
- Filter Results to a Standard File
Testers
- 30-65+ Years Old
- Household Income $40K-$100K
- Has HR or Benefits Management or Financial Software
- EDI Experience in HR
Scores & Responses
- Internal SUS Score: 92.5
- External SUS Score: 76.9
- Considerations: Move the filter button up, Be able to see documents that have been added to a file
Result
- Based on the above what is your assessment and next steps
- Side-by-side format and filtering process worked well
- Users didn’t mind the Mega Menu, but were a little confused despite using headings for each menu
Summarize & Iterate
Overall, the redesign of EDI Export History was a success!
The new version accomplished the following:
- Lowered cognitive load on users
- Reads faster and easier
- Now scalable and mobile ready
Future Considerations
- Incorporate various carrier API's
- How will this look in a multi-level view for Brokers